Getting started with MapVision
MapVision is an intuitive, easy to use web-based mapping application. You don't need to be familiar with Geographical Information Systems (GIS) or have knowledge of coordinate systems, projections or other technical geodata terms.
If you have access to postcode information and want to show that data on a map as quickly as possible in a variety of styles, overlaid on familiar atlas-style background maps, then MapVision can help. You can then share maps with colleagues or download a high-quality image for use in a presentation or printed material.
In addition to the below guide, you can view our dedicated tutorial playlist on YouTube.
To launch MapVision go to: https://mapvision.co.uk
Contents:
You can also see video tutorials on our YouTube channel
Importing your data
Getting your data into MapVision is a simple 3 step process:
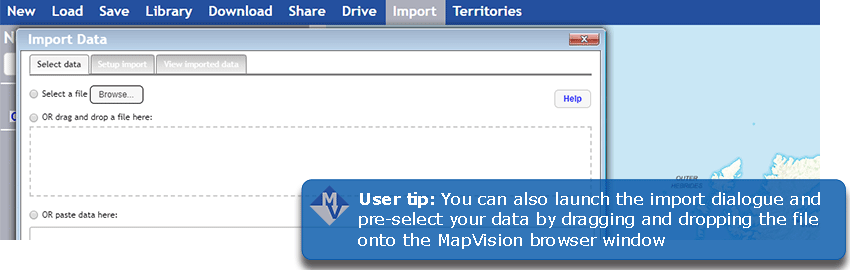
1. Select data
Open the Import dialog by clicking the Import button on the top menu, then select your data using one of 3 options:
- Browse for the data on your PC
- Drag and drop an Excel or CSV file onto the drag and drop section
-
Paste the data as text into the paste box – remember that consistency is important in your data, each postcode will need to sit on a separate line and all data fields should be separated with a comma. For example:
YO23 2BD, York Office
IP1 2AN, Ipswich Office
Next, click Upload, which will take you to the second tab.
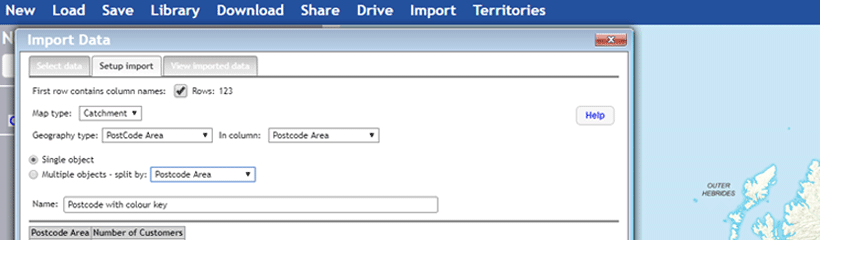
2. Setup import
Now, Choose what kind of map you want.
- Map Type is either a Catchment: A collection of postcodes or tiles to create a territory or catchment, or a Point set: points on a map showing specific locations or data points.
- Geography type allows you to specify the level of detail to match your data, whilst In column is the location that data is held in your data.
-
Single object will give a single map layer showing your data – used in most cases.
Multiple objects allows you to have multiple layers defined by the data you select in the drop down. For example, you might want a separate map layer for each named store or sales rep.
Click Next to go on to the final tab.
Starting a completely new project
When you open MapVision it will always have a new project open for you to start work straight away. If you need to start again though, for any reason, then just clicking on “New” in the top menu will reset to this fresh canvas. If you have done work on the existing project you will prompted to see if you want to save it before a new project is opened. A new project gives you a map of the entire UK. You can then either build up your data manually, or import datasets from other sources and entire GIS projects using the Library menu.
Bringing existing data into a project
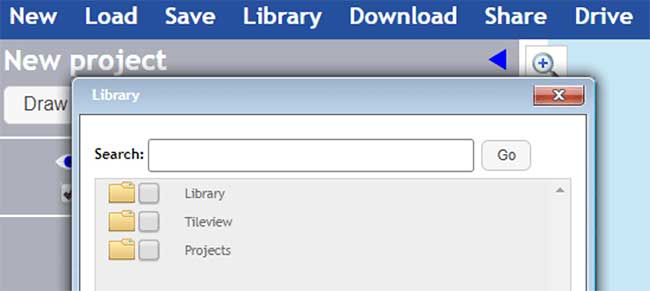
Data sources available through the Library menu:
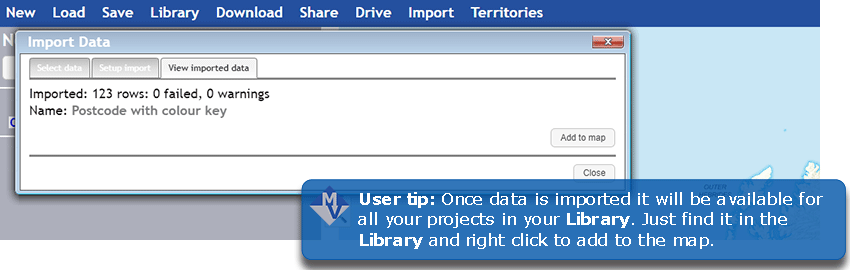
- Library: this is where you will import your data and will become your library. You can create folders to arrange your data conveniently. Once uploaded to MapVision, this data will be available in your account for any future projects.
- TileView: a read-only selection of boundary data to enable you to build catchments. The data included allows you to work to postcode or administrative geography.
- Projects: Projects you have saved and projects and data created by other users that have been shared with you appear here.
Clicking a folder icon will expand or collapse it. Click on the name to get a menu of folder options:
- Import: open the Import dialog
- Add folder: prompts for a name for the folder to create as a subfolder of this one
- Rename: prompts for a new name for this folder
- Delete: deletes this folder if it is empty
- Add catchment: prompts for a tile type (e.g. postcode sector) to use as the building block of a new, empty catchment
- Refresh: redisplays the contents in case they have been altered by another user or application
The Search box at the top of the menu allows you to find data in an alternative way. Entering your search text in the box and click or press Enter. Matching results are shown in a newly created folder called “Search results”. Objects can be added to the map from here.
Clicking on an object in a folder will give you a menu of options. The option given will vary depending on the type of object:
- Load project: the current project will be replaced by the selected project. If you have made changes to the current project you will be prompted to save it before it is replaced by the loading project
- Add to map: the catchment, pointset or network will be added as a new map layer and displayed on the map
- View tiles: for a catchment, browse the tiles that make up this catchment
- Browse: for a point set, browse the underlying table
- Add catchment: for a tile type, add a new, empty catchment whose building blocks are of this tile type
- Share: you will be prompted for the username of another user to share this object with. Once shared, the other user will be able to add the object to their projects.
The other user will receive an email notification - Delete: delete the object
- Rename: you will be prompted for a new name for the object. Objects can have the same name but it is easier to name everything uniquely
- Download: for a catchment, download to the browser a Comma Separated Value (CSV) file of the tile names
Navigating MapVision
If you are a new user or your previous login session has lapsed, you will be logged in as a guest user. Use the Account menu option to log in or register as a new user.
Top menu
This is where you will select the project you want to work on, import new data into it, save it and share it:
- New: start a new project. When you first open MapVision a new project is already created.
- Load: pick an existing project to open from the library.
- Library: this is where you store your data and projects, and access other data shared with you.
- Save: save the project you are working on. It will be stored in the Library.
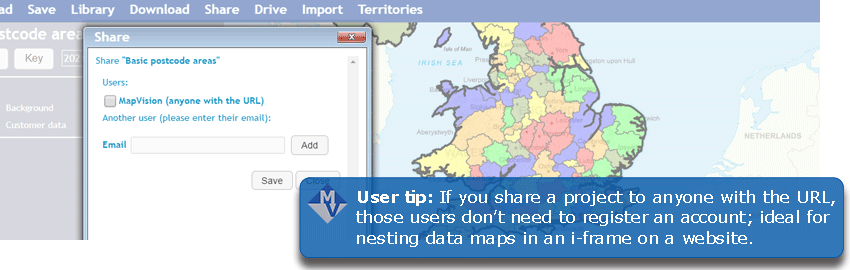
- Share: save this project and share it with other MapVision users.
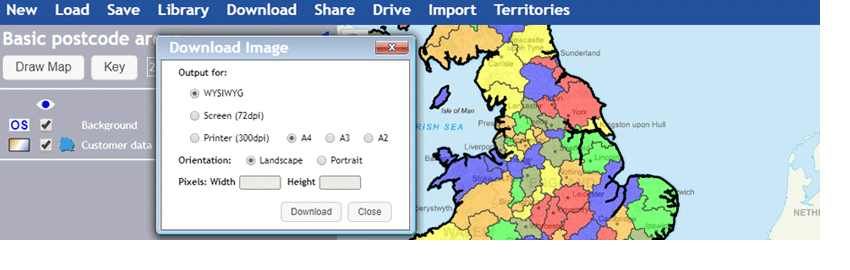
- Download: will create an image of what is displayed on the map and download it to your browser (as a PNG file). In some versions you can create images of higher resolution than the screen.
- Drive: show a dialog to create a drive time catchment area (“catchment”) made up of postcode sectors. This can be added to your Library and to the Map as a new Map Layer.
- Go to: type your search term into the box and matching suggestions will appear below. Select one to pan the map to that location. You need to type at least three characters. Postcodes, place names and street names are searched.
- Account: lets you switch users, log out, change password and manage your account by purchasing extra functions.
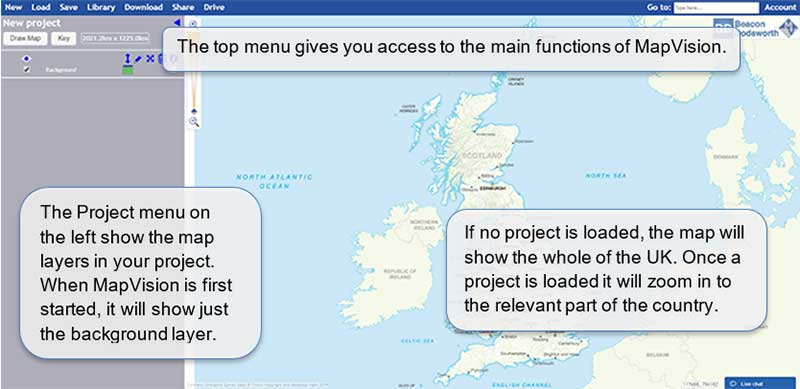
Map
- the map can be dragged using the mouse or touchpad
- to zoom in or out use the mouse wheel or the slider control in the top left. Drag the small diamond up or down to zoom in or out
- ">right-click on the map to get more options.
Project/left-hand menu
This houses the data interrogation and presentation tools that allow you to make geodata understandable for your audience.
Viewing your data
The Project Menu
The left hand pane contains information about your project and gives you the tools to edit, view and present the data how you wish. Each type of data you open from the library is shown as a separate data layer.
At the top of the menu you have two large buttons:
- Draw map will redraw the map to show all of the selected data layers at a suitable scale, location and extent. If none are selected it will refresh to a UK-wide map.
- Key toggles the display of the data key for the map on and off.
Working with data layers
- The layers are displayed from top to bottom in the order they will be drawn in.
- When a layer is added from the library, it is given the same name as the object in the library. You can change this by clicking on the name.
- To change the order of layers, drag a layer up or down. Normally when layers are added, catchments come before pointsets. Also see our video on re-ordering layers.
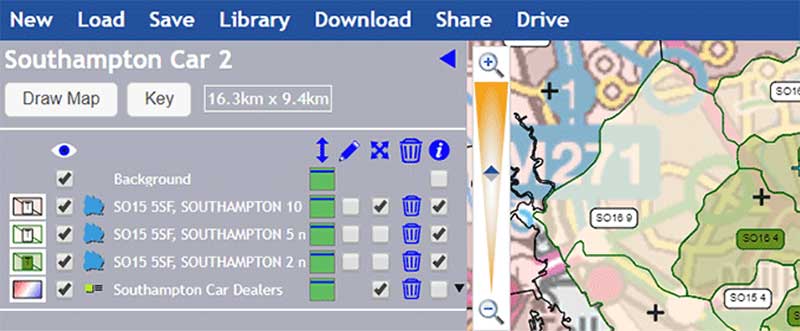
Each layer is displayed in a similar table-like format and shares the same functions. Running from left to right, they are:
- Styles swatch: on the far left, this box will appear differently depending on the type of data and style selected. Clicking on it will open the Style Editor which allows you to edit the way that particular data line appears on the map. More on this further on in the guide.
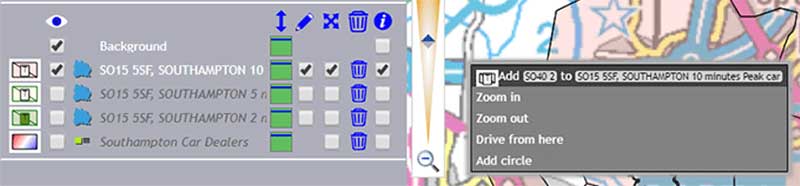
- Visibility check box: signified by the blue eye icon at the top of the column. A layer can be hidden or shown by clicking this check box.
- Layer name: clicking on the name allows you to edit it. If you wish, layers can have the same name.
- Scale: when first added, layers are displayed at all zoom levels. To limit when layers are drawn, click the “Scale” control. Sliding the small diamonds up and down will set a range of scales that the layer will be visible in. The eye icon indicates the current scale. If the eye icon has a line through it, the object is not visible at that scale.
- Edit content: allows you to add or remove areas to a particular catchment area
- Extent: ticking this box will set the map to display at a scale and location to show all of this data. So a national dataset will show a full UK map, but a regional dataset will automatically zoom in to show just that region.
- Bin: a layer is deleted by clicking the on the bin icon for that layer. Although deleted from this project, the data will still be available in the MapVision Library
- Information: when the check box under the “Information” icon is checked, you can click on the map to get information about objects on that layer in a popup box. For a catchment, the tile type, tile name and any associated data is shown. For a pointset, the associated data is shown. The display of this data can be configured.
-
More functions: when your cursor hovers over a line, a black arrow appears on the right-hand side. Clicking on this arrow opens a menu, specific to that layer type:
- Possible options are: Hide/Show, Show/Hide Popups, Rename, Don’t use/Use extent, Remove from Map. Each of these duplicate the options in the layer row itself and offer an alternative way to manipulate your data.
- Configure Popups allows you to control what is displayed in the popup boxes. It also controls what data is shown next to the symbol on the map for pointsets.
- The background layer line has options to set colour/grayscale or change how transparent/opaque the background map/raster is.
Editing your data
Editing catchments
When a catchment is added as a layer, tiles can be added and removed using the map. First, ensure that the check box under the pencil icon is checked to make the catchment editable.
When you right click on the map, options for each editable catchment appear in the menu. It is simpler to manage when only one catchment is set to be editable. If you click outside the catchment, an option to add the tile covering the point you clicked is added to the menu; if you click inside, the option is to remove the tile. If you have the “Use extent” check box checked for the layer and an added tile makes the catchment larger than the displayed area, the map will redraw to include the new tile.
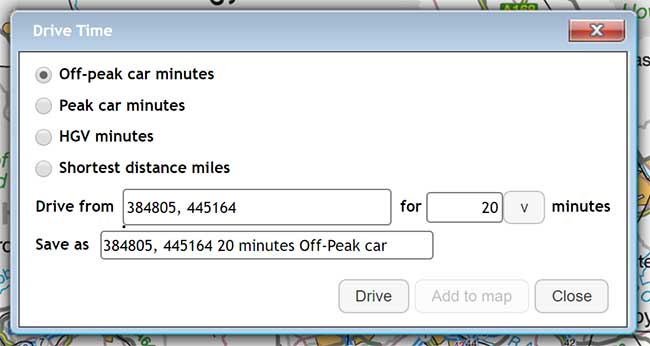
Drive-time-based catchments
Right click on the map will launch the drive time dialog. This creates a catchment based on a simulated drive time out from the point selected on the map. You can set the type of travel: peak, off-peak, HGV or shortest distance and the number of minutes/miles driven from this menu. When it has been created the “Add to Map” button is enabled. It will also be added as a catchment in project menu.
The Drive menu bar option also opens the same dialog. In this case you need to set the start point by using the search box. Like the map pan search, this will accept a postcode or place name.
Editing Styles
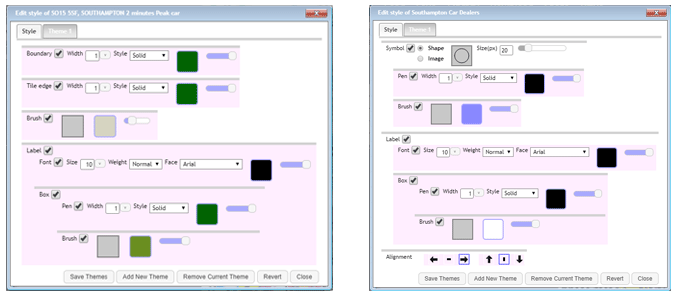
A layer’s style is edited by clicking on the swatch on the left. This launches a dialog.
There are some things common to all styles such as a visibility check box to show or hide the whole substyle, for example to suppress labelling a catchment or point set, uncheck the check box next to the word “Label”. For simple styles, the map will change to reflect your style changes. For complex styles (themes), you need to refresh the map layer by clicking “Apply all styles”.
Many sub styles have common elements, such as a slider to control how transparent a brush or pen is. Colour swatches [img] can be clicked to select a colour from a palette. Pattern swatches can be clicked to select a different shape or fill pattern.
Catchment styles
- Each tile has a fill (brush) and outline (pen) style
- The whole catchment has an outer boundary line style (pen) and tile names are displayed in the Label style
- Tile labels are always displayed in the best place in the tile
Also see our video on styling catchments.
Pointset styles
- Each point is displayed as a symbol and a label. The symbol consists of a shape (circle, square, etc) whose size, fill colour (brush) and outline colour (pen) can be changed. The map will reflect changes you make here
- The label consists of a font and a box. The box will resize to fit the label’s text content.
- The alignment controls are used to position the label relative to the symbol. The normal position is centred, to the right
- To select the columns to display in the label, use Configure Popups. The check boxes on the left determine which columns will be displayed
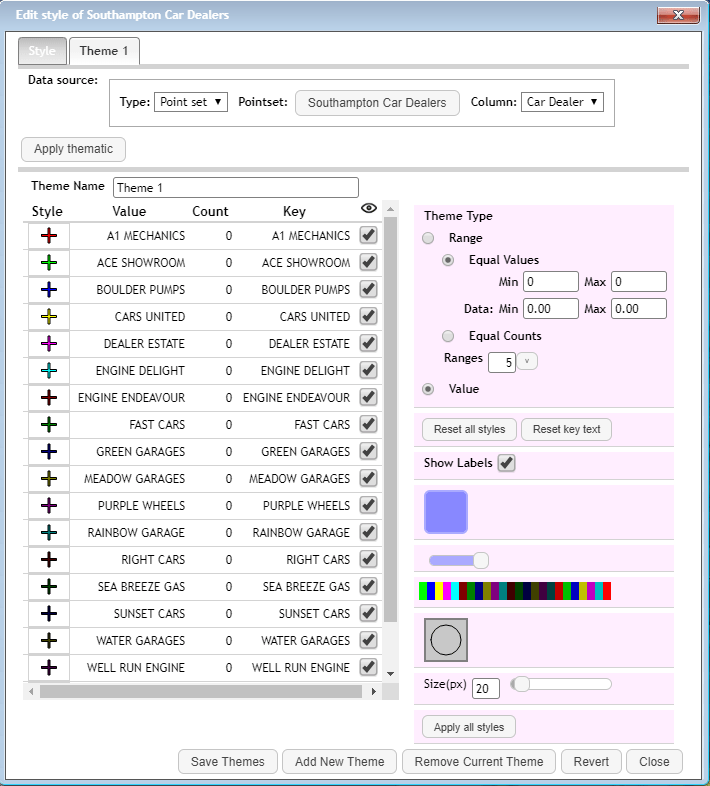
Setting a theme
By default, newly added layers are given a simple style where every item in the pointset or catchment has the same style. Often we want to style items differently based on some other value that we imported, or demographic data that is built-in. In this case we can create a Theme. In the Style dialog, click on the Theme tab at the top to set one up.
The top part of the dialog has a “Data source”. This usually comes from the data you imported. For example, a pointset might represent sales outlets with turnover, or a catchment might have a territory code attached. For a pointset, select a column from the drop-down list of columns. Click Apply.
On the right-hand side there are two Theme types: ranges of numeric data, or discrete values - usually non-numeric data. You can switch between these types using the option buttons “Range” and “Value”. The number of ranges can be altered for a Range-type theme. You can set the minimum and maximum values and the lower and upper bounds of the ranges will be split evenly.
Each range of data has its own style which can be edited by clicking on the individual Style icon on the left-hand-side. To change the shape, colour or opacity for all ranges, use the tools in the bottom right of the dialog box.
The map display does not automatically update when you edit a theme. You can update the map layer by clicking “Apply all styles”.
Also see our video on styling catchments and applying a theme.
Sharing your project
MapVision is designed with sharing and online collaboration in mind. Before you start to share a project consider the sensitivity of the data you are sharing and how widely you would like to share it. Once you've decided, MapVision should give you the tools you need to share it effectively.